|
|
|
Quantification of Ultrasound Contrast Agents
By Darryl Ma, Graduate Student
Professor Michael L. Oelze
It is well known that Ultrasound Contrast Agents (UCA), because of their scattering properties, enhance the diagnostic capabilities of ultrasonic imaging by increasing the image contrast between a selected location and the background. However the relationship between intensity and quantity of UCAs remains poorly defined. The goal of this project is, therefore, to quantify UCAs in vivo and in vitro by analyzing its ultrasound backscatter response.
Theory

In the equation, C is equal to (π4/36c4) where c is the speed of sound in the medium, f is frequency, D is the diameter of the scatterer, represents the scatterers per unit volume, represents the mean-squared variation in acoustic impedance between scatterer and surrounding medium, and is the form factor, which is a function of frequency and scatterer diameter.
Equation (1) indicates that the backscatter response should be linearly proportional to the concentration of UCAs. That is, if the concentration of UCAs is increased by a factor of four, the power of the backscattered signal should also be increased by a factor of four. Early experiments have confirmed this supposition (refer to Table 1). Additionally, experiments have suggested that the backscatter response is heavily dependent on the size of the scatterers. In fact, equation (1) suggests that the power of the backscatter response, if the scatterers are assumed to be spherical, will be proportional to the volume of the scatterers squared. Early experiments have also confirmed that the power of the backscatter response is heavily dependent on the size of microbubbles.
| Concentration Ratios |
0.1x : 1x |
1x :2x |
0.1x : 2x |
| Ratio of Initial Ultrasound Backscatter |
3.306 |
1.604 |
5.302 |
Measured Concentration Ratios from Hemacytometer |
3.036 |
1.589 |
4.823 |
| Percentage Difference |
8.89 |
0.944 |
9.93 |
Table 1 Comparing ratio of microbubble concentrations measured from hemocytometer and ultrasound backscatter
Image Processing
Because of the dependence of the backscatter response on scatterer size, estimating the size of the microbubbles became a necessity. Two Matlab programs were created to analyze jpeg image files of the microbubbles acquired under a light microscope. One program analyzed the UCA size in the spatial domain and the other in the Fourier domain. In Fourier domain, the average diameter was calculated from the width of the jinc function�s main lobe (refer to Figure 3). Both programs were used to process all images to verify the accuracy of each program. Table 4 shows that the mean diameters of UCAs obtained from each program strongly agree with each other.
a) 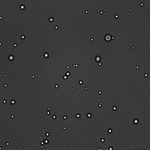 b) b)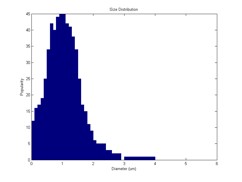
Figure 2 - .jpeg image of UCAs under a light microscope and corresponding size distributions of UCAs
a)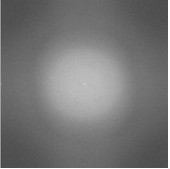 b)
b)
Figure 3 - a) 2D FT of .jpeg image and b) 1D horizontal slice of image to the left
| Diameter |
After Vialmix |
Out of Refrigerator |
| Mean (um) (spatial domain analysis) |
2.100 |
1.013 |
Mean (um) (Fourier domain analysis) |
2.103 |
1.049 |
| Percentage Difference |
0.143% |
4.55% |
Table 4 - Comparing mean diameter of UCAs obtained from two Matlab programs for two different samples
Future Work
At the moment, all experiments have only been conducted within a 250mL beaker. Future work will involve quantifying UCAs in vitro within a perfusion phantom and in vivo within a rabbit ear.
References
[1] H. Medwin. Counting bubbles acoustically: a review. Ultrasonics,7-13, 1977.
[2] L. E. Kinsler, A. R. Frey. Fundamentals of Acoustics. John Wiley & Sons, Inc. 1950.
[3] M. F. Insana, T. J. Hall. Parametric Ultrasound Imaging from Backscatter Coefficient Measurements: Image Formation and Interpretation. Ultrasonic Imaging, 12, 245-267, 1990.
[4] M. F. Insana, T. J. Hall, R. F. Wagner, D. G. Brown. Describing Small-Scaled Structure in Random Media using Pulse-Echo Ultrasound. Journal of the Acoustical Society of America,87, 179-192, 1990.
[5] N. de Jong, L. Hoff. Ultrasound scattering properties of Albunex microsphere. Ultrasonics31, 175-181, 1993.
[6] N. de Jong, L. Hoff, T. Skotland, and N.Bom. Absorption and scatter of encapsulated gas filled microspheres: theoretical considerations and some measurements. Ultrasonics30, 95-103, 1992.
[7] S. L. Bridal, O. Lucidarme, J-M. correas, P. N. Burns, J-F. Moreau, G. Berger. Quantification of Ultrasound Contrast Agent in an In Vitro Perfusion Phantom. IEEE Ultrasonics Symposium, 1759-1762, 1999.
[8] Victor C. Anderson> Sound Scattering from a Fluid Sphere. The Journal of the Acoustical Society of America,22, 426-431, 1950.
|
|