
|
|
Quantitative Ultrasound Identification of Fatty and Fibrotic LiverNonalcoholic fatty liver disease (NAFLD) is the most common cause of chronic liver disease and can often lead to fibrosis, cirrhosis, cancer and complete liver failure. Liver biopsy is the current standard of care to quantify hepatic steatosis, but it comes with increased patient risk and only samples a small portion of the liver. Imaging approaches to assess NAFLD include proton density fat fraction (PDFF) estimated via magnetic resonance imaging (MRI) and shear wave elastography. However, MRI is expensive and shear wave elastography is not proven to be sensitive to fat content of the liver (Kramer, et al. 2016). On the other hand, ultrasonic attenuation and the backscatter coefficient (BSC) have been observed to be sensitive to levels of fat in the liver (Lin, et al. 2015, Paige, et al. 2017). In this study, we assessed the use of attenuation and the BSC to quantify hepatic steatosis in vivo in a rabbit model of fatty liver. Rabbits were maintained on a high fat diet for 0, 1, 2, 3 or 6 weeks with three rabbits per diet group (total N = 15). An array transducer (L9-4) with center frequency of 4.5 MHz connected to a SonixOne scanner was used to gather RF backscattered data in vivo from rabbits. The RF signals were used to estimate an average attenuation and BSC for each rabbit. Figure 1 shows the results of the Folch assay on the different rabbits.
Two approaches were used to parameterize the BSC, i.e., the effective scatterer diameter (ESD) and effective acoustic concentration (EAC) using a spherical Gaussian model and a model-free approach using a principle component analysis (PCA). The two major components of the PCA from the BSCs, which captured 96% of the variance of the transformed data, were used to generate input features to a support vector machine (SVM) for classification. Rabbits were separated into two liver fat level classes such that approximately half of the rabbits were in the low lipid class (£ 9% lipid liver level) and half of the rabbits in the high lipid class (> 9% lipid liver level). The slope and the mid-band fit of the attenuation coefficient provided statistically significant differences (p-value = 0.00014 and p-value = 0.007, using two-sample t-test) between low and high lipid fat classes. Figure 2 shows a feature analysis plot of the attenuation estimates for the different classes of fatty liver.
The proposed model-free and model-based parameterization of the BSC and attenuation coefficient parameters yielded classification accuracies of 84.11 %, 82.93 % and 78.91 % for differentiating low versus high lipid classes, respectively. Figure 3 shows a feature analysis of the ESD versus the EAC. Figure 4 shows a feature analysis plot of the PCA components.
The results suggest that attenuation and BSC analysis can differentiate low versus high fat livers in a rabbit model of fatty liver disease. This work was supported by a grant from NIH (R21EB020766). BRL Projects >> |
|||||||||||||||||||||||||||||||||||||||||||||||||||||||||||||||
| Bioacoustics Research Lab. |


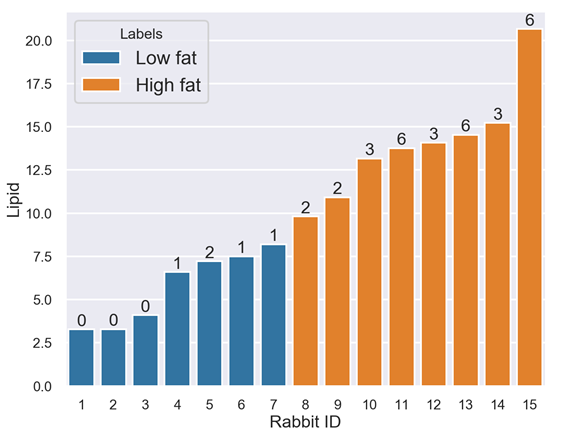 Figure 1. Estimate values of lipid levels (%) for the lvier from each rabbit
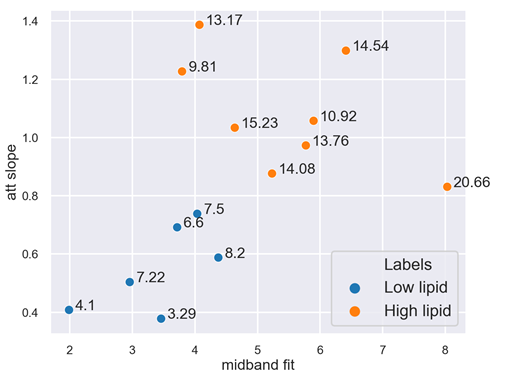 Figure 2. Feature analysis plot of estimated attenuation slope and mid-band fit for each rabbit. The numbers represent the Folch lipid level value.
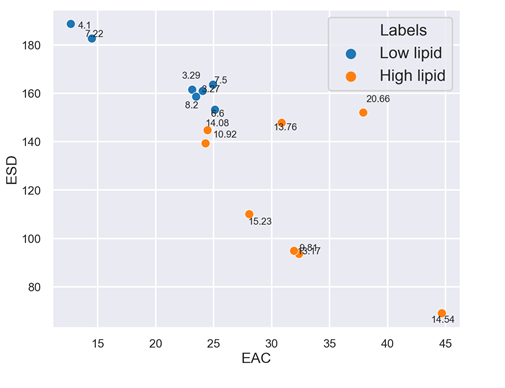 Figure 2. Feature analysis plot of estimated ESD veruss EAC. The numbers represent the Folch lipid level value.
 Figure 2. Feature analysis plot of estimated PCA components. The numbers represent the Folch lipid level value.