|
|
Tissue Characterization through Ultrasonic BackscatterCharacterization of tissue microstructure with ultrasonic backscatter. The histogenetic classification (epithelial vs. mesenchymal) and the assessment of benign (adenoma vs. benign mesenchymal) versus malignant (carcinoma vs. sarcoma) behavior of tumors are based on established guidelines following light microscope evaluation of stained tissue sections. These guidelines [Cotran et al., 1994] include the evaluation of:
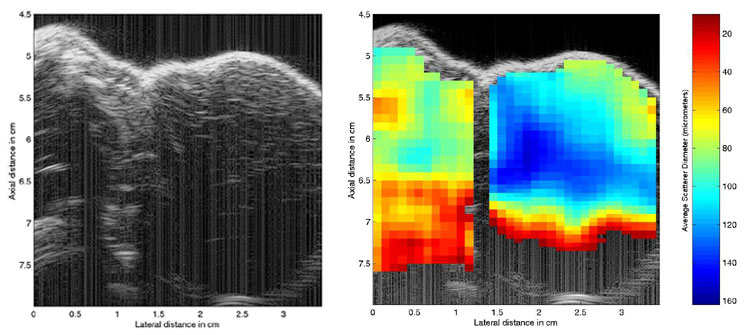
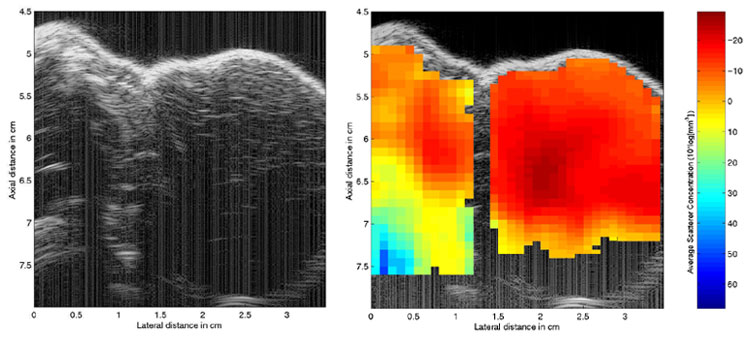
Conventional ultrasound B-mode images of tumors and surrounding healthy tissues are useful in identifying the first microscopic feature listed by Cotran and often times able to distinguish the second microscopic feature. In order to image the remaining microscopic features, ultrasound B-mode images must be constructed utilizing a much higher frequency range, i.e. 300 MHz and above to image the smallest microscopic features listed above. Operating at these high frequencies is not always feasible due mainly to the large attenuation of the echo signals that results in greatly limited depth of penetration. Quantifying the smaller microscopic features is important to properly identifying the type of tumor (cancerous vs. noncancerous). At present, accurate detection and classification of solid tumors is obtained through light microscope evaluation of biopsied and stained samples, an invasive technique. This study quantifies small-scale structures through ultrasound backscattering from small particles or perturbations in tissues and solid tumors for the purposes of noninvasive in vivo classification of tumors. Parametric ultrasound B-mode images will be constructed utilizing the properties of the scatterers in the tissues. Specifically, the spatial distribution of the average scatterer diameter and scatterer concentration will be determined to form diagnostic quality images, that is, a parametric image. A composite image may be constructed that superimposes the parameterized image for selected regions of interest (ROIs) on conventional B-mode images. The noninvasive in vivo experiments of this study focus on forming and interpreting ultrasonic parametric images from tumors grown in rats and from surrounding healthy tissues. The initial B-mode ultrasonic images are constructed over the frequency ranges of 2-12 MHz. The parameterization of tissue structures from backscatter are conducted over the frequency ranges of 5-12 MHz and then superimposed on the existing B-mode images for enhancement. The conventional B-mode images resolve the first two microscopic features listed above. It has been noted [Insana and Hall, 1990] that the most accurate measurements of small-scale structure through scattering occur when the ka value (acoustic wavenumber times the effective scatterer radius) is between 0.5 and 1.2. The frequencies, and associated acoustic wavenumbers, chosen for the parameterization allow for the third and fourth microscopic features listed by Cotran to be measured. B-mode images of the scanned area are constructed. Regions of interest in the B-mode images are examined for the spectral content of the backscattered RF echoes. The average scatterer size and concentration are determined by comparing the measured normalized power spectrum from each ROI to a theoretical power spectrum. The theoretical power spectrum is modeled according to the shape and distribution of scatterers postulated for the tissue. In soft tissue scattering, the spatial distribution of scatterers is assumed to be statistically stationary so that the distribution can be described in terms of a stochastic function, the spatial autocorrelation. In most cases of soft-tissue scattering, the Gaussian correlation function and associated form factor have been shown to correctly describe tissue structures. Enhanced B-mode images are created by relating small pixels to average scatterer properties like the average scatterer diameter and average scatterer concentration. Figure 1 shows a conventional B-mode image of a rat with a spontaneous mammary tumor along with an enhanced B-mode image with superimposed pixels related to the average scatterer diameter. Similarly, Figure 2 represents an enhanced B-mode image with superimposed pixels corresponding to the average scatterer concentration. The enhanced B-mode images are made by assuming an attenuation of .7 dB/MHz/cm. The enhanced B-mode images show structures not seen in the ordinary B-mode image and could lead to improved detection and classification of diseased tissues.
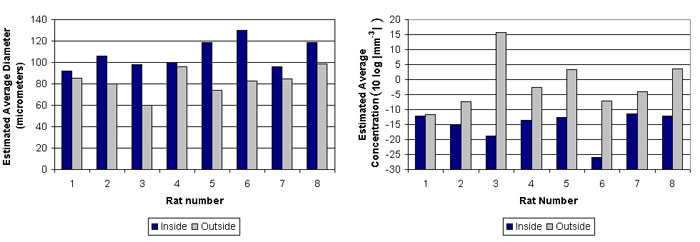
A novel estimation scheme was utilized in this work [Oelze et al., 2001] to obtain scatterer parameters assuming a Gaussian form factor. The new estimation scheme reduces the calculation time required over previous estimation schemes [Chaturvedi and Insana, 1996] while maintaining the same expected variance in the estimate. Acoustic evaluation of scatterer properties from the Gaussian form factor will be verified by light microscope evaluation of the tissue microstructure. Ultrasound waves detect changes in the mechanical properties of the tissues while light microscopy detects electromagnetic (dielectric) changes in the tissues. Scattering particles are expected to have both mechanical and electromagnetic differences with surrounding tissues. There will not be a one-to-one correlation between mechanical and electromagnetic property changes in the scattering particles, but the optical characteristics should give an approximation of shape and size that can be related to acoustic estimations. In total, eight rats that had developed spontaneous mammary tumors were scanned and processed. A comparison of the scatterer property estimates made inside the tumors and outside the tumors showed a distinct difference. Figure 3 shows a histogram of the estimated scatterer properties inside and outside the tumors. In the case of the average scatterer diameters, diameters estimated from inside the tumor were shown to be larger than estimates made outside the tumors. On average there was a 30% increase in diameter sizes estimated inside the tumors. ANOVA statistics were used to test for significant differences between estimates inside and outside and were found to be significant in a majority of cases. For the estimated average concentration, concentrations inside the tumors were seen to be less than concentrations outside the tumors in each rat. Test of significance showed that in all rats (except rat 1), there was a significant difference between estimates made inside and outside the tumors.
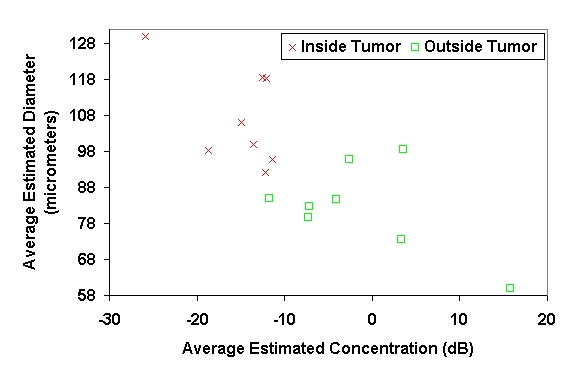
Further distinctions can be seen by looking at a plot of the feature analysis for the eight rats. Figure 4 shows a plot of the feature analysis for the eight rats (average scatterer diameter versus average scatterer concentration). A clear separation can be seen between estimates made inside the tumor and estimates made outside the tumor. In Fig. 4 the lower right quadrant of the graph is made up of the estimates outside the tumor while the upper left quadrant describes the estimates made inside the tumor. The distinct separation between estimates made inside and outside the tumors may be useful to characterizing and classifying different tissues for disease diagnosis.
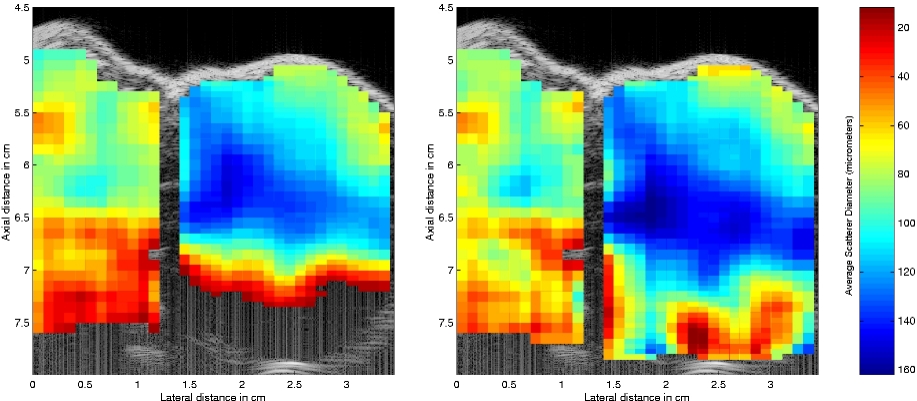
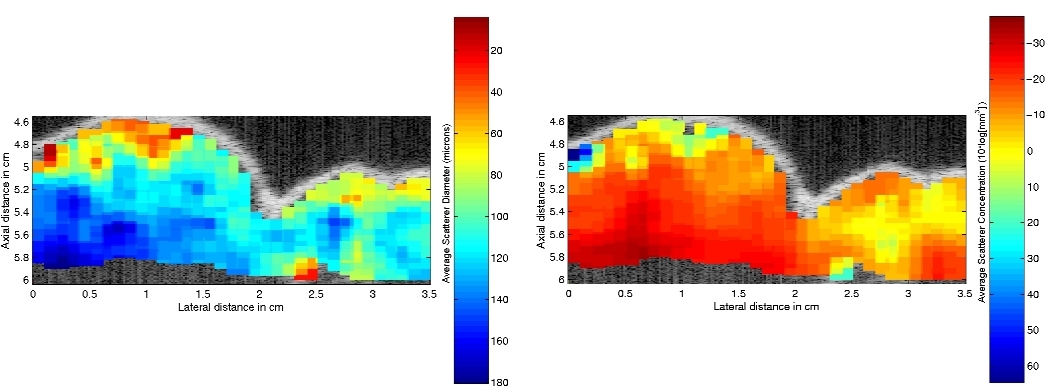
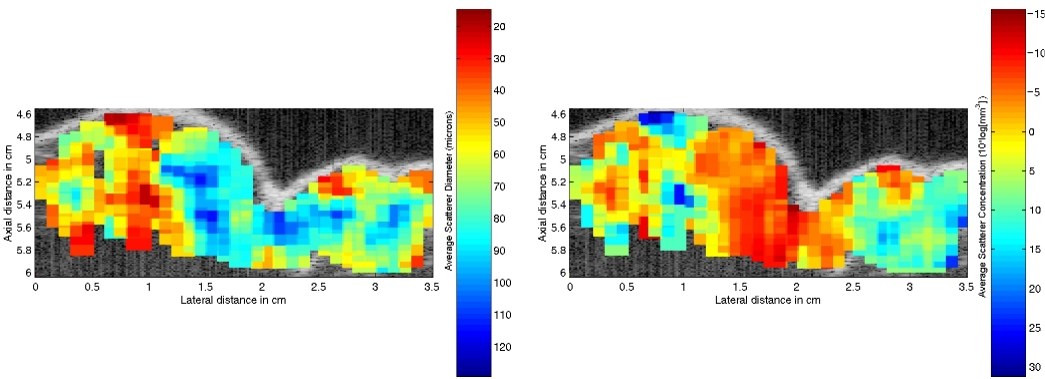
After optimizing the scattering estimation measurement, average scatterer size and concentration estimates for ROIs inside the tumor can be compared with estimates from surrounding tissues. A database of scattering properties for tissues inside tumors and in normal tissues will be gathered for further analysis. The mean value and variance about the mean value of scattering properties will then be used to determine if there exist absolute threshold values for scattering properties in detecting and possibly identifying disease. If no absolute thresholds can be determined, then a relative measure must be employed. The relative measure will take a case-by-case study of scattering properties from each animal by comparing diseased tissues with the normal tissues. Light microscopic data will be important to determine whether the scattering measurement and theory correctly predict the scattering parameters. Effects of re-estimating the attenuation. Scattering parameters are estimated from the frequency dependence of the normalized power spectrum of the backscattered RF signal that is gated from each ROI. The frequency dependence of attenuation means that accurate quantification of scatterer properties requires proper compensation of attenuation effects over the gated region. New attenuation algorithms [Oelze and O'Brien, 2001] are applied to the backscattered RF signals gated from each ROI in order to achieve improved scatterer estimates. Attenuation does not necessarily have the same frequency dependence or magnitude from one tissue region to the next. Further improvements in scattering estimates are achieved by estimating the attenuation from the backscattered RF signal of different ROIs. Taking the values of the attenuation to re-estimate the scatterer parameters allows for improved enhanced B-mode images. Figures 5 and 6 shows enhanced B-mode images of average scatterer diameter and average scatterer concentration with the assumed attenuation and with attenuation estimated from the backscatter. The tumor is located on the left side between 0 and 2 cm laterally. The local attenuation was estimated by taking 1 mm X 1 mm columns and examining the signal as the propagation depth increases per column. The scattering is assumed homogeneous per column so that the only difference between echoes near and far is just the added attenuation losses per depth. From Figure 5 it can be seen that there exists a depth dependence on the estimates. As the propagation gets deeper, the scatter size estimates increase (decrease for concentration). The depth dependence is due to inaccurate attenuation values used for signal compensation. By using attenuation values estimated from the backscatter per column, several changes can be noticed in Figure 6. First, the depth dependence is taken out with a more proper attenuation estimate. Second, further structure can be seen in the tissues when the depth dependence is taken out. Third, the assumption of homogeneous scattering down a single column is incorrect. This means that attenuation estimates are not correct. In order to achieve better estimates, further progress needs to be made in estimating the local attenuation for each ROI and for estimating the attenuation of intervening tissues.
New frequency-dependent attenuation-compensation function. One of the obstacles to making accurate estimates of scatterer properties like the average scatterer diameter is correctly compensating for frequency dependent attenuation losses to the measured backscatter spectra. Point attenuation compensation has been used in the past to compensate for signal loss when the gated segment is short or the attenuation is small. The normalized power spectrum is compensated for round-trip attenuation losses using point compensation by the following equation
where Wmeas and Watten represent the compensated and attenuated
backscattered power spectra, respectively, x0 is the distance between the source
and the gated region, L/2 is the distance from the edge of the gated region to the middle of
the gated region and In order to obtain more accurate estimates of scatterer diameters, the effects of larger attenuation or attenuation from longer gated signals need to be more accurately compensated. Attenuation-compensation functions are described by the following equation:
where A represents the frequency-dependent attenuation-compensation function. An approximate closed form attenuation-compensation function, A, for backscattered returns that more accurately described the frequency-dependent losses than point attenuation compensation was first introduced by Sigelmann and Reid (1973 ) and utilized by O'Donnell and Miller (1984). The O'Donnell and Miller attenuation-compensation term is given by
The term in brackets accounts for the frequency-dependent attenuation losses over the gated region.
The term outside the brackets accounts for the round-trip frequency-dependent attenuation losses
between the gated region and the source. The O'Donnell and Miller compensation function is based
on the approximation of small attenuation or short gate length over the frequencies of interest.
The simulations of Section II will show that the compensation term used by O'Donnell and Miller
gives better estimations for scatterer estimations than the point attenuation-compensation term
at longer gate lengths and larger attenuations. However, as A new frequency-dependent attenuation compensation function was proposed by Oelze and O'Brien (2002) that took into account the attenuation effects for larger attenuation or larger gate length. The attenuation-compensation function derived by Oelze and O'Brien was similar in form to the O'Donnell and Miller compensation term
To first and second order expansion of the exponential term in the denominator the O'Donnell and
Miller function and the Oelze and O'Brien functions agree. However, the overall compensation of the
Oelze and O'Brien function is larger than the O'Donnell and Miller compensation term. Figure 7 shows
the estimates of the average scatterer diameter from an unattenuated signal and an attenuated signal
using point compensation, O'Donnell and Miller compensation and Oelze and O'Brien compensation.
The Oelze and O'Brien compensation function yields superior results to the other compensation functions.
The point compensation immediately yields underestimates of the scatterer sizes, the O'Donnell and Miller
compensation function begins to overestimate the scatterer sizes and the Oelze and O'Brien slowly begin
to yield underestimates of the scatterer size as the product of the attenuation and gate
length,
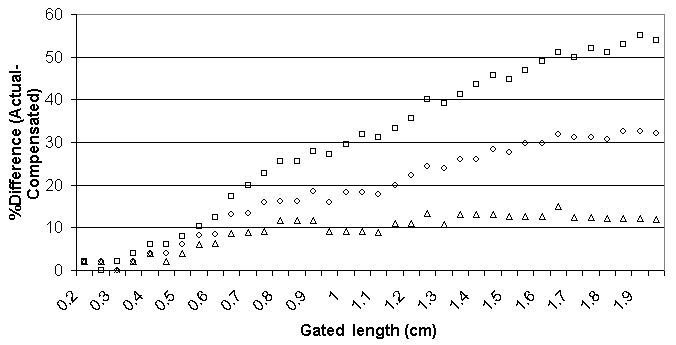
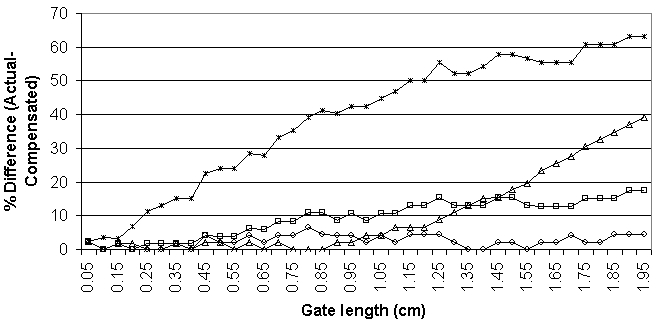
Figure 8. Comparison of the percent difference between the estimation of average scatterer diameter between the un-attenuated scatter returns and attenuated scatter returns with various compensation routines, a = 0.7dB/MHz/cm; D , Point compensation; □, O'Donnell and Miller compensation; à , Oelze and O'Brien compensation; *, uncompensated.
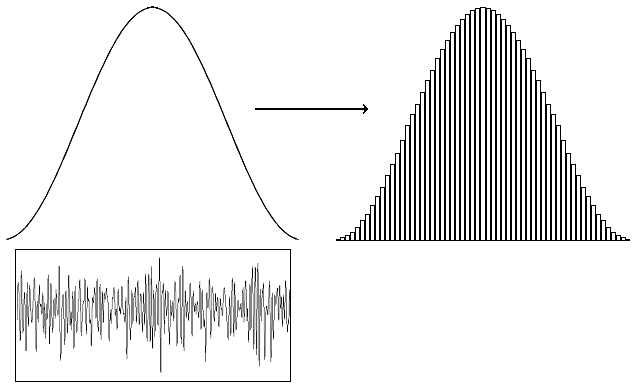
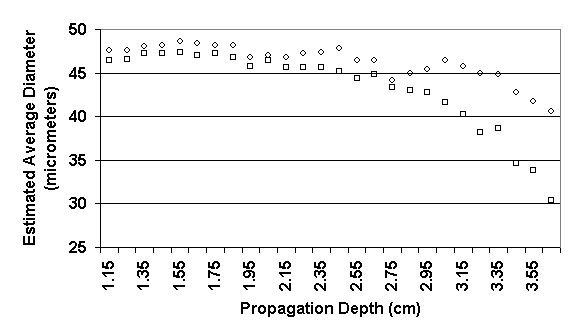
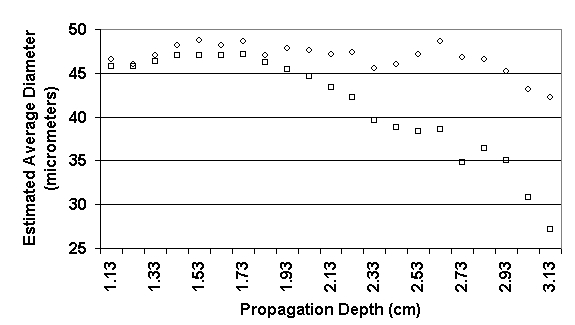
Figure 9. Scatterer diameter estimations from simulated backscatter returns of randomly distributed Gaussian scatterers with average diameters of 49 micrometers using different attenuation-compensation algorithms and an unattenuated backscatter return, a = 0.9dB/MHz/cm; D , Point compensation; □, O'Donnell and Miller compensation; à , Oelze and O'Brien compensation; *, unattenuated estimates. The Oelze and O'Brien compensation function was also adjusted for use with arbitrary window functions applied tot he gated RF signals used to obtain the backscattered power spectrum. The window function was implemented into the compensation function by assuming that the window function changed very slowly with respect to the backscattered signal. When the window function could be considered slowly varying with respect to the signal, the window function could then be thought of as a number of rectangular windows of width dx and height dependent on the distance in the gate length. Figure 9 illustrates the conversion of a typical window into a series of rectangular windows. By summing up the attenuation and the rectangular windows over the gate length, L, an adjusted compensation function could be obtained. As an example, choosing the Hanning window gave an adjusted attenuation-compensation function
Comparison of the estimates in Figure 10 made from backscattered signals gated with the Hanning window and compensated with different compensation functions shows that the Oelze and O'Brien compensation function adjusted for the Hanning window yielded superior estimates for the average scatterer sizes.
Figure 9 Illustration of the Hanning window broken into small rectangles when the window function is slowly varying with respect to the backscattered signal.
Figure 10. Comparison of the percent difference between the estimation of average scatterer diameter between the unattenuated scatter returns and attenuated scatter returns using the Hanning window and various compensation routines, a = 0.7 dB/MHz/cm; D , Oelze and O'Brien (Hanning adjusted) compensation; □, O'Donnell and Miller compensation; à , Oelze and O'Brien compensation. Increasing the sensitivity of scatterer estimates. As the sound propagates through the tissues, the sound is attenuated and scattered from small microstructures. The attenuation and the scattering are frequency dependent. Furthermore, the initial excitation pulse will have a higher magnitude at the central frequency and lower magnitude at the bandwidth edges (-6dB). As the excitation pulse propagates, typically the higher frequencies are attenuated more rapidly than the lower frequencies. Likewise, different frequencies scatter with different amplitudes based on the size and shape of the scatterers. Inherent in any signal is noise. Those frequency components in the scattered power spectrum that tend to have small magnitude due to the initial excitation bandwidth, the attenuation and the scattering amplitude will also tend to have a smaller signal to noise ratio (SNR). Frequency components with small SNR can lead to greater inaccuracy in the estimates of the scatterer properties. Weighting different components in the analysis frequency bandwidth according to their expected SNR can reduce the effects of the noise on the estimation of scatterer properties. Extending the work done by Chaturvedi and Insana (1996, 1997) studies were conducted on improving the accuracy of scatterer estimates in high noise situations. Simulations and phantom experiments were conducted to determine what improvement in scatterer estimations could be made by weighting certain frequency components according to their expected SNR. Figures 11 and 12 shows the results of a simulation and phantom experiment for glass bead scatterers (49 ± 2.5 micrometers) embedded in an agar phantom. By weighting the frequency components in the analysis bandwidth according to the excitation bandwidth, the expected attenuation and the expected scattering amplitudes, improvement in scatterer property estimations were made as the backscattered RF signal became more noisy. Essentially the SNR weighting increased the depth to which estimates of scatterer properties could be made. Extending the tissue depth to which scatterer estimates can be made is useful to ultrasound diagnostic capabilities.
The effects of the SNR weighting can also be seen from the parametric image of Figure 13. The tumor in the rat of Figure 6 is located on the right side from about 1.3 to 3.5 cm in the lateral direction. The axial length of the tumor in Figure 13 extends almost 2.5 cm in depth. The parametric image created without the SNR weighting (left) began to give increasingly inaccurate estimates at around 6.5 cm in depth until at around 7 to 7.1 cm estimates were unable to be made at all. The parametric image created with the SNR weighting (right) allowed estimates of scatterer properties to be made throughout the total length of the tumor. The diagnostic capability was improved by using the SNR weighting to the analysis bandwidth.
References. Chaturvedi, P. and M.F. Insana, "Error bounds on ultrasonic scatterer size estimates," J. Acoust. Soc. Am. 100, 392-399 (1996). P. Chaturvedi and M. F. Insana, "Bayesian and least squares approaches to ultrasonic scatterer size image formation," IEEE Trans. Ultrason. Ferroelec. Freq. Cont., 44, 152-160 (1997). Cotran, R. S., V. Kumar, S. L. Robbins. Robbins Pathologic Basis of Disease, 5th edition. pp. 214-303 (Chapter 7, Neoplasia), W. B. Saunders Company, Philadelphia, (1994). Insana, M.F. and T. J. Hall, "Parametric ultrasound imaging from backscatter coefficient measurements: Image formation and interpretation," Ultrason. Imaging 12, 245-267 (1990). M. L. Oelze, W. D. O'Brien, and J. F. Zachary, "Ultrasound image based on ultrasound characterization of tissue microstructure of spontaneous rat mammary tumors," J. Acoust. Soc. Am. 109, 2360 (2001). M. L. Oelze and W. D. O'Brien, "Comparisons of frequency-dependent attenuation-compensation functions for ultrasonic signals backscattered from random media", Submitted J. Acoust. Soc. Am. (7/16/2001). O'Donnell, M. and J.G. Miller, "Quantitative broadband ultrasonic backscatter: An approach to nondestructive evaluation in acoustically inhomogeneous materials," J. Appl. Phys., 52, 1056-1065 (1981). Sigelmann, R. A. and J. M. Reid, "Analysis and measurement of ultrasound backscattering from an ensemble of scatterers excited by sine-wave bursts," J. Acoust. Soc. Amer, 53, 1351-1355 (1973). BRL Projects >> |
|||||||||||||||||||||||||||||||||||||||||||||||||||||||||||||||
| Bioacoustics Research Lab. |


 (1)
(1) ,
,  are
the frequency-dependent attenuation coefficients in Np/cm for the intervening medium and over the gated
region, respectively. The attenuation over the gated region is assumed to be constant.
are
the frequency-dependent attenuation coefficients in Np/cm for the intervening medium and over the gated
region, respectively. The attenuation over the gated region is assumed to be constant. (2)
(2) (3)
(3) becomes
larger the O'Donnell and Miller compensation function begins to yield increasingly inaccurate
estimates of scatterer diameters. Furthermore, the O'Donnell and Miller attenuation compensation
term was constructed for rectangular windowing of the gated RF backscattered signals.
becomes
larger the O'Donnell and Miller compensation function begins to yield increasingly inaccurate
estimates of scatterer diameters. Furthermore, the O'Donnell and Miller attenuation compensation
term was constructed for rectangular windowing of the gated RF backscattered signals. . (4)
. (4)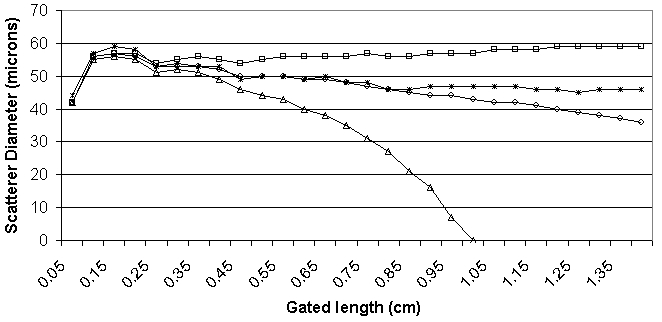
 . (5)
. (5)