
|
|
In situ Calibration for Backscatter Coefficent EstimationThe backscatter coefficient (BSC) has demonstrated the ability to classify disease state and to monitor changes in tissue due to therapy. However, traditional methods of estimating the BSC in vivo using a reference phantom technique do not account for transmission losses due to intervening layers between the ultrasonic source and tissue region to be interrogated, leading to increases in bias and variance of BSC-based estimates. To account for transmission losses, an in situ calibration approach is proposed. The in situ calibration technique employs a titanium sphere that is well-characterized ultrasonically, biocompatible and embedded inside the sample. Ultrasound scattered from the sphere encounters the same transmission loss and attenuation as the investigated sample and can be used as a reference spectrum. To evaluate titanium spheres as in situ calibration targets, a set of experiments were conducted. The first experiment quantified the signal strength of titanium spheres of three sizes: 0.5-, 1- and 2-mm diameter. The second set of experiments assessed the repeatability of BSC estimates from the titanium spheres and compared these BSCs to theory. The third set of experiments quantified the ability of the titanium bead to provide a calibration spectrum in the presence of lossy layers. The final set of experiments quantified the ability of the spheres to provide a calibration spectrum over multiple depths in the sample. All experiments were conducted using a L9-4/38 linear array connected to a SonixOne system. Figure 1 show B-mode images of 0.5-, 1- and 2-mm diameter titanium beads in agar phantoms. The strongest signal was observed from the 2-mm titanium bead with a SNR of 11.61 dB. Hence, the 2-mm diameter bead was used in subsequent experiments.
Figure 2 shows curves of the BSC from the 2-mm diameter titanium bead estimated from measurements and from the theory of Faran. Even with the larger bead size, estimates of the BSC from the bead were in good agreement with theory, the mean differences between experiment and Faran theory were 0.41 ± 3.36 dB and 0.08 ± 3.02 dB using the array and single element transducer, respectively.
Figure 3 shows B-mode images of the phantoms with and without a fatty layer over the top. Figure 4 shows BSC curves using different calibration procedures. The BSCs estimated using the in situ calibration approach with and without the layer present overlapped with the BSC estimated using the traditional reference phantom approach without the layer present. The BSC estimated using the traditional reference phantom approach with the layer present did not overlap with the other curves. The mean differences of the BSCs, using the BSC from the reference phantom without a layer as baseline, were 0.16 ± 2.29 dB, 1.95 ± 2.99 dB and 10.90 ± 3.64 dB using the in situ calibration approach without the layer, with the layer and using the reference phantom approach with the layer, respectively.
Figure 5 shows B-mode images of the data blocks used for the estimation of BSCs. Figure 6 shows BSC curves produced from data blocks at different depths. The mean differences of the BSCs calculated from data blocks located at depths that were either 30 pulse lengths above or below the actual bead depth compared to the BSC calculated at bead depth were 1.23 ± 2.05 dB and 1.48 ± 1.54 dB, respectively. The results indicate that an in situ calibration target can account for overlaying tissue losses thereby improving the robustness of BSC-based estimates.
BRL Projects >> |
|||||||||||||||||||||||||||||||||||||||||||||||||||||||||||||||
| Bioacoustics Research Lab. |


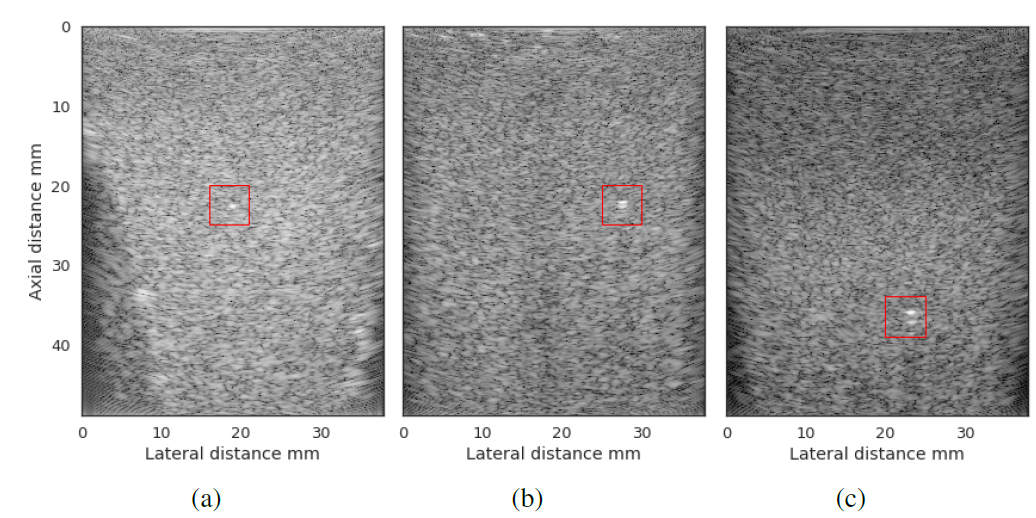 Figure 1. B-mode images of (a) 0.5-mm diameter titatnium bead, (b) 1-mm bead and (c) 2-mm diameter bead
 Figure 2. Comparison of Faran theory of scattering from a 2-mm diameter titanium sphere compared with measurements from the sphere using a single-element transducer and from using the linear array L9-4/38.
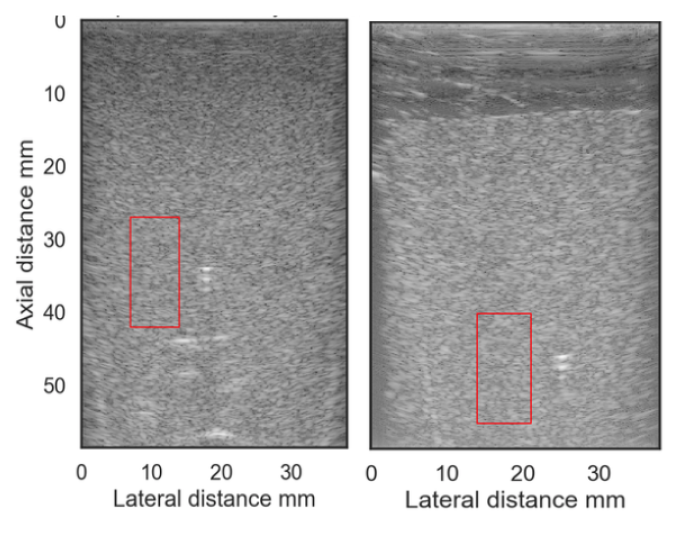 Figure 3. B-mode images of phantoms without (left) and with (right) the layer on top.
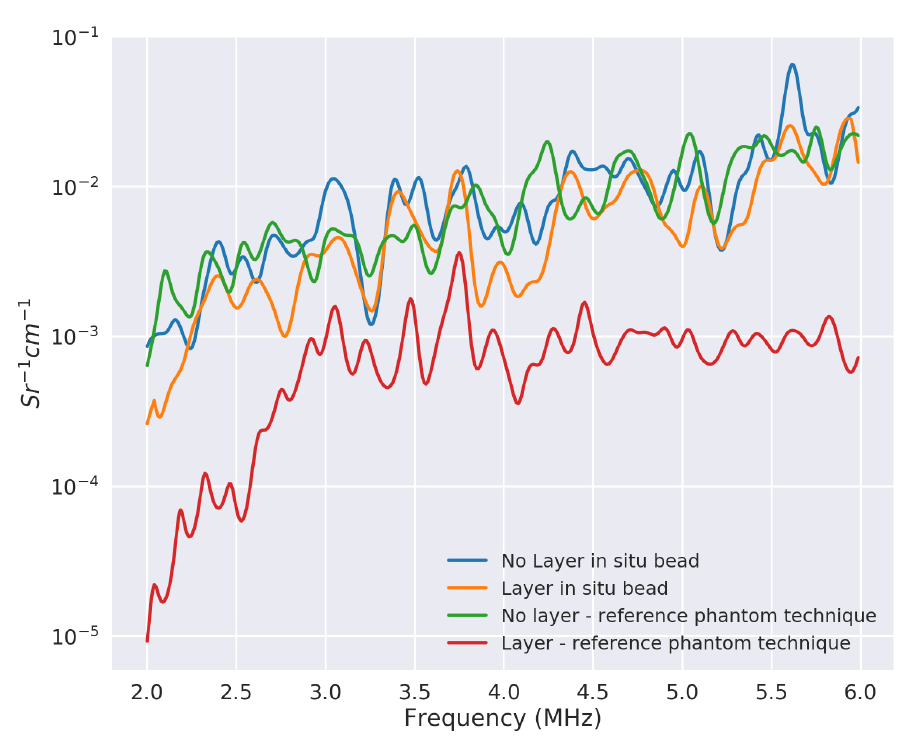 Figure 4. BSCs from phantom using calibration bead and reference phantom technique.
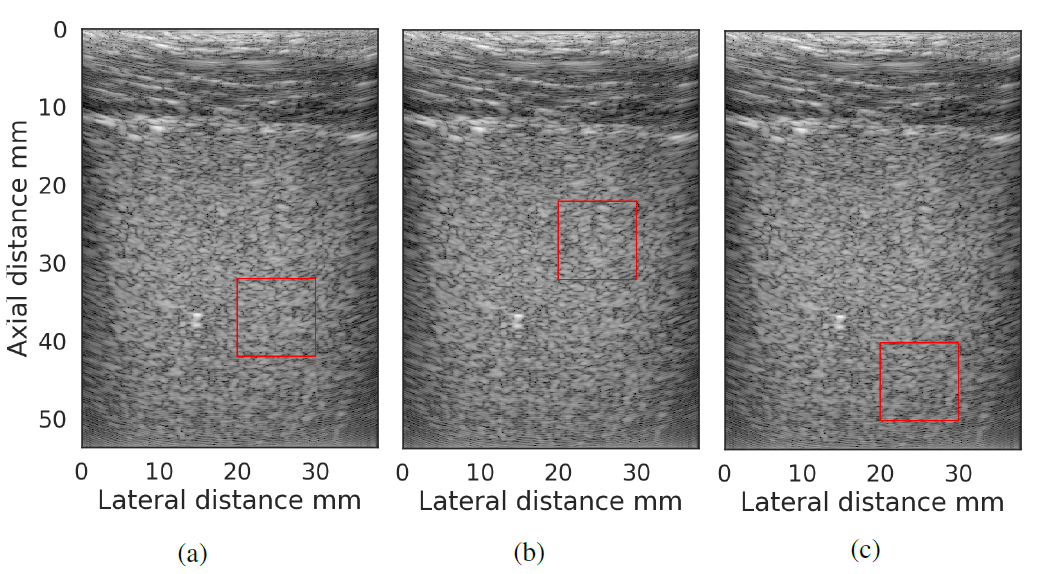 Figure 5. a) Data block to calculate the BSC at bead depth and (b) and (c) data blocks above
and below the bead to compare with BSC estimates from (a). The dynamic range of the images was 60 dB.
Figure 5. a) Data block to calculate the BSC at bead depth and (b) and (c) data blocks above
and below the bead to compare with BSC estimates from (a). The dynamic range of the images was 60 dB.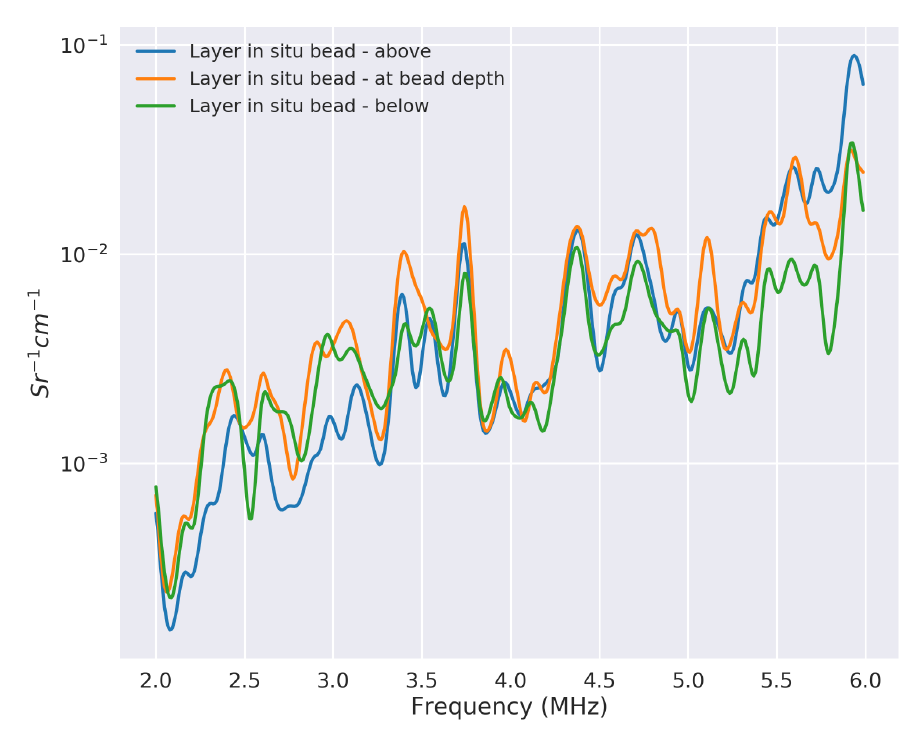 Figure 6. BSCs from data blocks located at different depths relative to the bead depth.